Greenspace Access and
Mental Health in Edinburgh
This was the major assignment during Semester One of the MSc at Edinburgh, spanning three separate courses and completed in teams of five or six. Each group focused on one aspect of greenspaces within the city of Edinburgh, and our group chose to investigate the relationship between access to greenspace and mental health benefits for the city’s residents. In addition to identifying, gathering, cleaning, and analysing the data we would need to investigate this relationship, the project required the creation of a series of database tables in Oracle to hold much of our data, the production of a web map to make the results publicly available, and significant project management to deliver the project on time. Beyond the usual project management challenges, the ongoing Coronavirus restrictions in place at the time (the project was undertaken between October 2020 and January 2021) meant that we started the project with team members in Edinburgh and China, and completed all of the work remotely using Zoom, Microsoft Teams, and shared space on the School of GeoSciences computer network to facilitate collaboration.
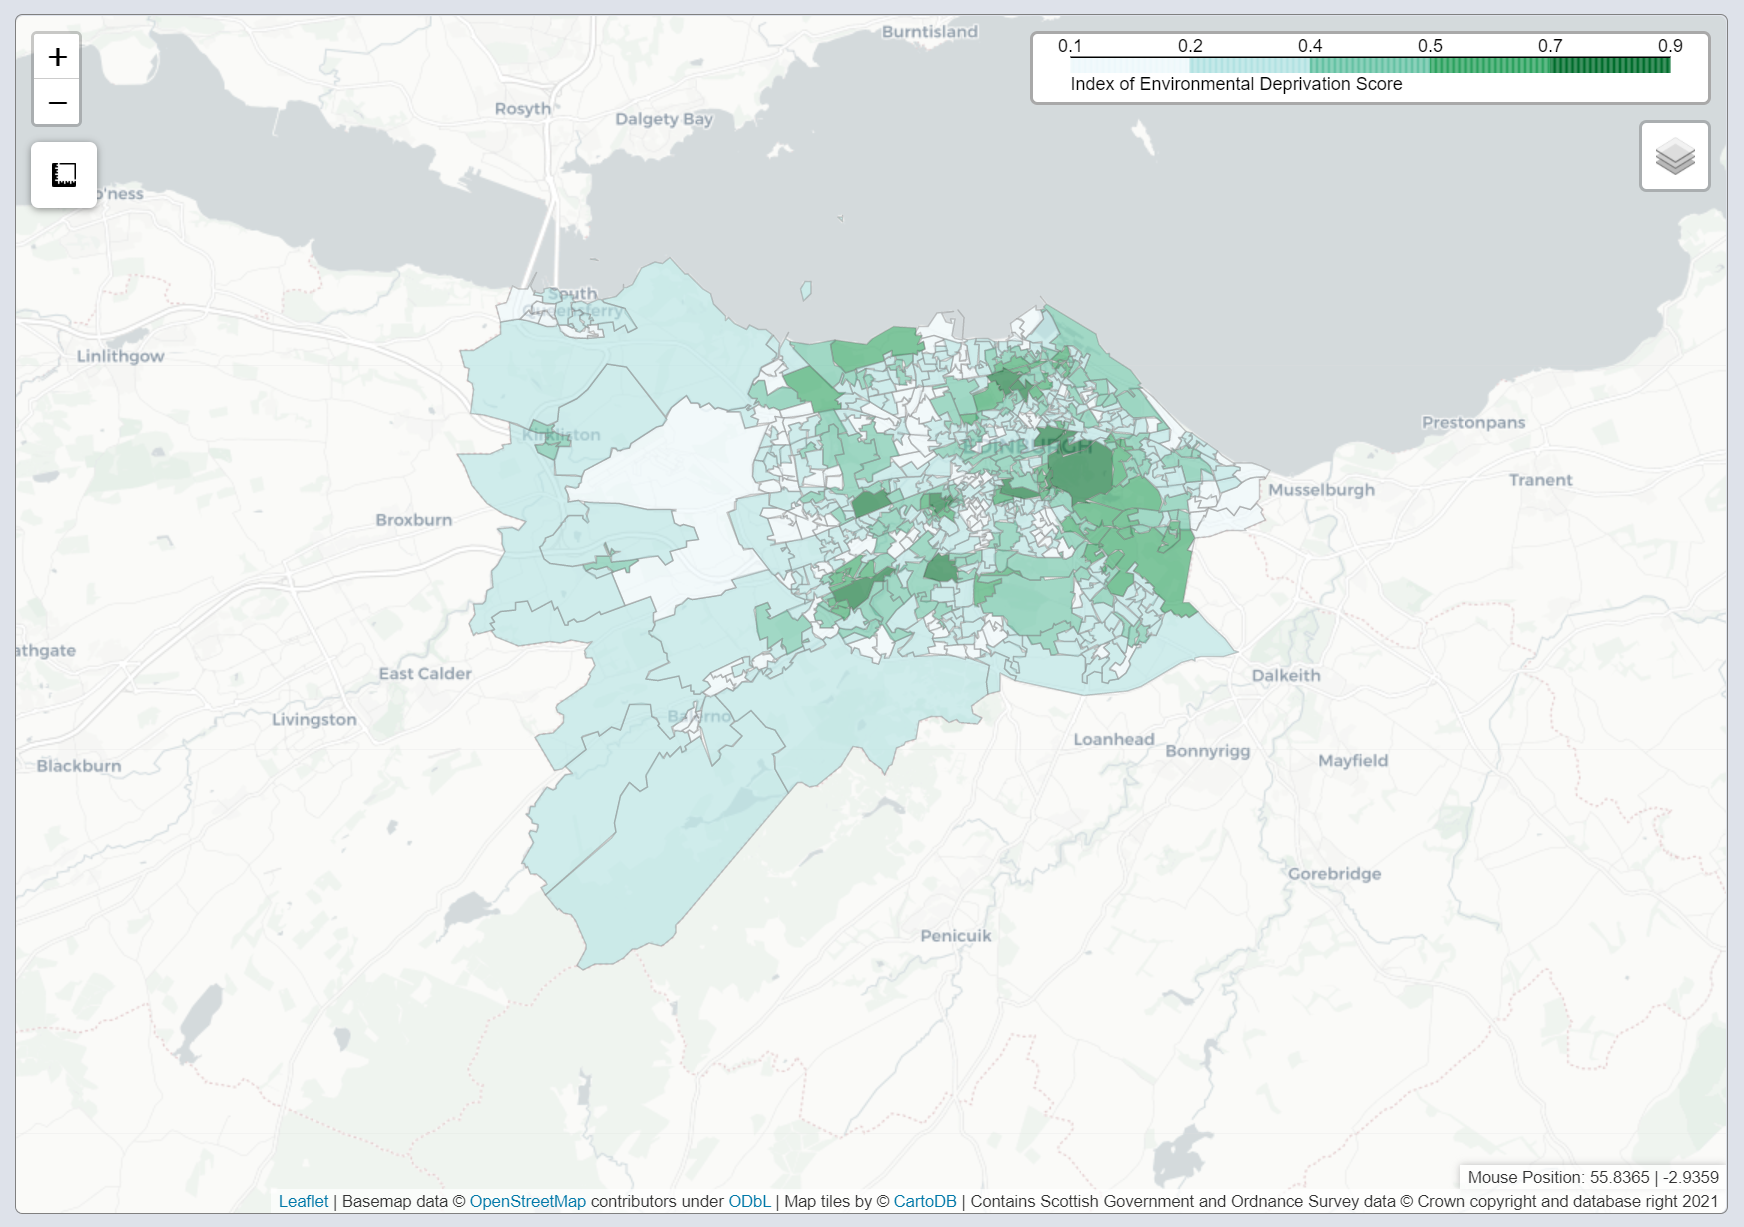
To investigate any relationship between access to the city’s greenspaces and mental health outcomes we developed an Index of Environmental Deprivation (IED), and compared this to mental health metrics in the Scottish Government’s Scottish Index of Multiple Deprivation (SIMD). The group website contains more information on the project background and methods, as well as the web map that I built as one of the major project components, a partial image of which is displayed below.
The web map was one of three major deliverables for the project and was my first experience with web mapping. The site uses Jinja templates to embed content generated in a Python script into a standard HTML webpage. In this case, that embedded content primarily consisted of a Folium map. Folium is a Python library that enables mapping using the Leaflet JavaScript library. Using Folium, rather than Leaflet directly, allowed us to connect to Oracle, where much of the data our spatial analysis had generated were stored, as well as to use Python to manipulate the data extracted from those database tables into a form which could be passed to, for example, map pop-up markers.
The map takes advantage of many of the features of Folium, including choropleth map layers, such as the one in the image above that shows the IED score for each of Edinburgh’s 597 SIMD datazones, marker clusters, and heat maps. The user can customise many aspects of the map through a series of HTML forms, which pass the input back to the Python script and in many cases determine the database SQL queries that are executed.
View the full Edinburgh satellite image in the page header here.
