
Analysis of Candidate Landing Sites for Future Mars Rover Missions
The previous ‘Workflow’ page described the process of conducting the suitability analysis. Here I will analyze the results and evaluate how ‘successful’ the process was, primarily by comparing the locations of my highest scoring sites to actual sites that have been considered as finalists during the landing site selection process for the Mars Science Laboratory (MSL) and Mars2020 missions.
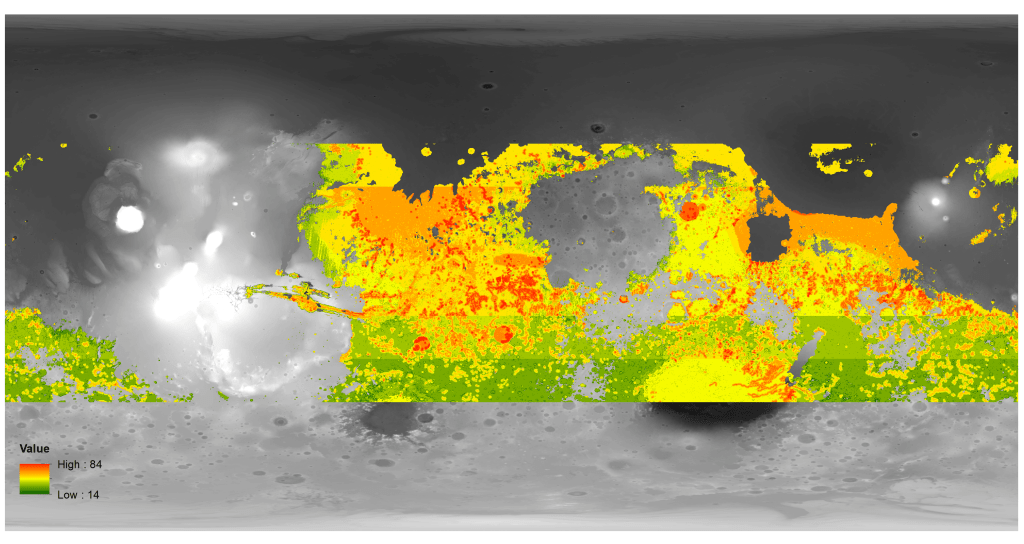
The image below is the full, planet-wide suitability raster containing 1.06 billion individual cells. The lowest scoring regions are shown in dark green (minimum score is 4) and the highest scoring regions are shown in dark red (maximum score is 84).

The image below is the result of applying the mask, which eliminated areas that do not meet one or more of the latitude, elevation, albedo, thermal inertia, or geology constraints, as described in the previous page. This new raster contains approximately 245 million of the original 1.06 billion cells. The grayscale background image here is the raw MOLA digital elevation model (DEM). The lightest spots in the west are the tall volcanoes of Olympus Mons (the single large white spot and the highest point on Mars) and the neighbouring Tharsis volcanic province to the SE. The lowest point on Mars is within the enormous Hellas Basin, which is the partially visible dark area towards the bottom right of the image. This masked raster eliminates the lowest scoring regions, with cell values now falling in the range 14 – 84.
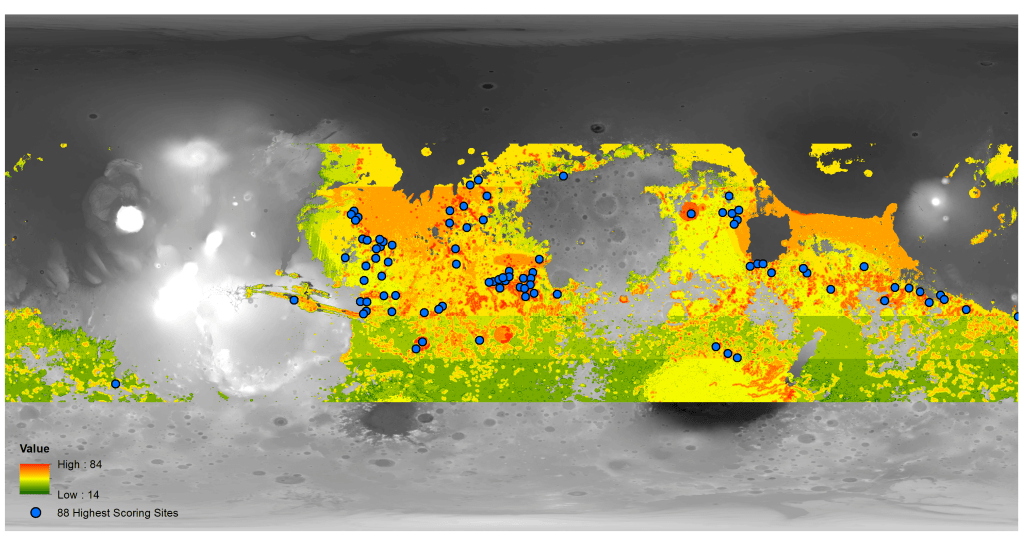
Analysis of the distribution of scores reveals that cells with values ≥ 57 (~ 1.85 million individual cells) represent the top 0.75%, while cells with values ≥ 56 represent the top 2.2%. As such, the ~ 1.85 million cells with values ≥ 57 (max. 84) were further extracted to a new raster.
The extracted subset of cells were converted to polygons, yielding over 14,000 individual polygons, and sorted into descending order by score. Regions of adjacent polygons were manually selected and named, beginning with the highest scoring polygons (if anyone with GIS experience knows of a better way to select and/or automatically group adjacent polygons with different values please let me know – I’m sure this was not the most efficient way to accomplish this!). By the time all regions with a maximum score of 66 or more had been grouped and named, a total of 8510 of the 14,047 polygons had been included and named (60.5%). These highest scoring regions were dissolved on the name field to yield polygons representing 88 separate regions. These 88 regions are illustrated in the figure below and the following table summarizes details of the highest scoring such regions.
| Name | Max. Score | Mean Score | Latitude | Longitude | Size (km2) | Mission |
|---|---|---|---|---|---|---|
| Eberswalde Crater | 84 | 63.20 | -23.9 | 326.3 | 20,892 | MSL & M2020 |
| Gale Crater | 81 | 63.80 | -4.5 | 137.4 | 11,460 | MSL* |
| Gale SE | 80 | 62.10 | -6.5 | 141.2 | 2,205 | |
| Milna Crater | 77 | 63.21 | -23.5 | 347.8 | 1,081 | |
| Robert Sharp Crater | 76 | 61.56 | -5.1 | 132.9 | 4,760 | |
| Holden Crater | 75 | 60.85 | -26.4 | 325.1 | 5,406 | MSL & M2020 |
| Ismenius Cavus | 75 | 61.95 | 33.7 | 17.1 | 1,995 | |
| Subur Vallis | 75 | 62.72 | 11.9 | 307.2 | 1,621 | |
| Subur Vallis Crater SE | 75 | 62.28 | 11.5 | 308.8 | 738 | |
| Hellas NE 1 | 72 | 60.75 | -29.5 | 77.7 | 796 | |
| Lederberg Crater SW | 72 | 62.74 | 11.8 | 313.2 | 2,192 | |
| Sibut Crater SE | 72 | 61.94 | 8.5 | 312.0 | 535 | |
| Jezero Crater | 71 | 61.04 | 18.5 | 77.4 | 2,041 | M2020** |
| Marwth Vallis | 70 | 61.37 | 24.0 | 341.1 | 23,408 | MSL & M2020 |
| Unnamed Sirenum Crater | 68 | 62.29 | -38.6 | 221.1 | 106 | |
| Miyamoto Crater | 66 | 62.67 | -3.34 | 352.3 | 461 | MSL |
The final column in the table above indicates whether a location was one of the final candidate sites during NASA’s selection process for the MSL (Curiosity rover) and Mars2020 (Perseverance rover) mission landing sites. This list includes the final 7 sites under consideration for the MSL mission, and the final 10 sites under consideration for the Mars2020 mission. Four sites were finalists for both missions – Eberswalde Crater, Holden Crater, Marwth Vallis, and Nili Fossae. Of these four, only Nili Fossae failed to be included in my analysis. The criteria that made it so attractive to NASA but failed to be captured in my analysis is not immediately apparent. The presence of many of these ‘real’ contenders in my list of high-scoring sites appears at first glance to validate the process. However, it is likely that this argument is at least somewhat circular. These sites are likely included in many of the datasets that I used in my analysis precisely because they have been the subject of intense study during NASA’s landing site selection processes. However, there are many sites on my list that have not, to my knowledge, been subject to this heavy scrutiny by NASA and the wider planetary community. This suggests that several of the sites in Table 3 are legitimate locations for consideration during the selection process for any future rover mission with broadly similar science and engineering constraints and criteria as those used here (which were drawn from the real MSL and Mars2020 criteria).
In conclusion, a planet-wide suitability analysis combining science and engineering criteria, using publicly available data from NASA, the ESA, and the USGS, was able to successfully identify many candidate landing sites for future rover missions to Mars. Several sites that have been carefully considered by the planetary community for recent or upcoming NASA missions feature in my top scoring sites, including the ultimate destinations for the MSL (Gale Crater) and Mars2020 (Jezero Crater) missions.
The final page in this section of the site hosts the final map that I made for the capstone project.
