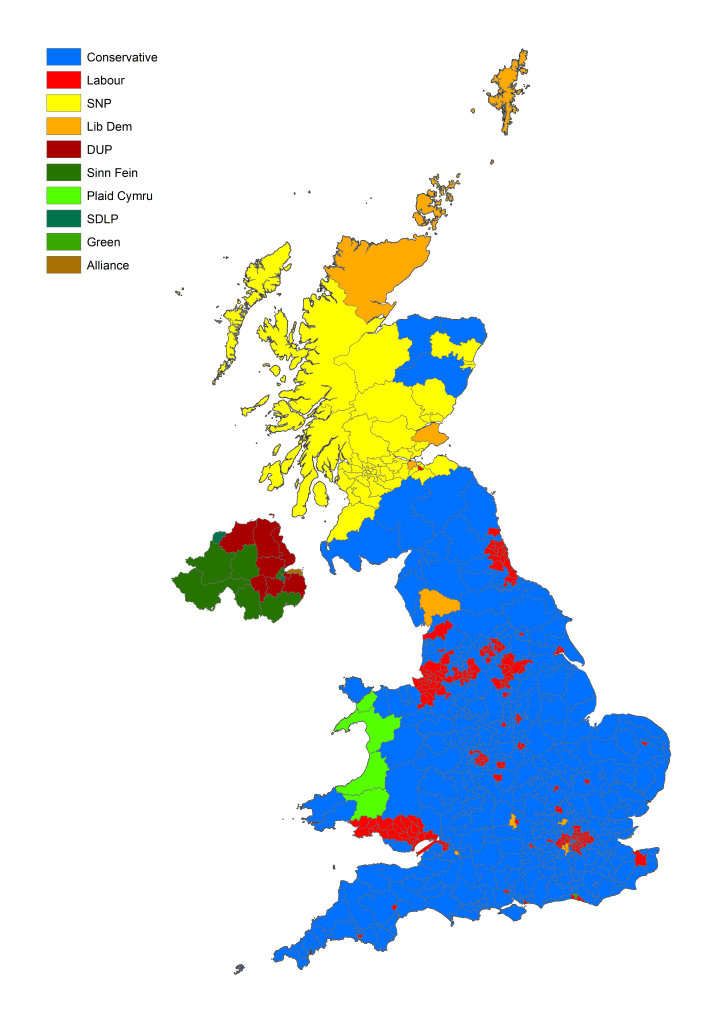
When I began this journey into the world of GIS in January 2020, the United Kingdom was only a couple of weeks past its most recent general election, the first that I had been in the country for in over 20 years. The very first map I made in ArcGIS was the attempt seen here to recreate the final election results map, a variant of which was in every newspaper and on every news website and tv show.
The map shows every Westminster parliamentary constituency, using data from the Ordnance Survey’s Boundary Line product, symbolised with the colour of the winning candidate’s party for each seat, using a csv file of official results from the House of Commons Library.
In time I hope to add more maps analysing the results and hopefully a link to an interactive geoapplication on ArcGIS Online.