One of my first tasks when I joined 2Excel Geo in April 2022 was to develop a web map that displayed all of the sites that we had planned to collect data for and the collection status of those sites. This was information that was stored in a database that the Geo team had access to on our system and could visualise in GIS software (QGIS). However, there was a need for wider members of the company who did not have access to our server or experience with the software (e.g., the Operations team, pilots, sensor operators, etc.) to be able to easily view the same data.
The solution that I implemented, which built upon skills that I developed both during the MSc at Edinburgh as well as my own independent learning on Coursera, was a Leaflet-based web map that connected to the MySQL database where the data were stored via PHP. This allowed the web map to be updated in real-time in response to edits to the database made by members of the Geo team through a separate QGIS plugin that already existed. In this way the Ops team in Doncaster, and pilots and SOs anywhere in the country, could be kept up-to-date with the latest information.
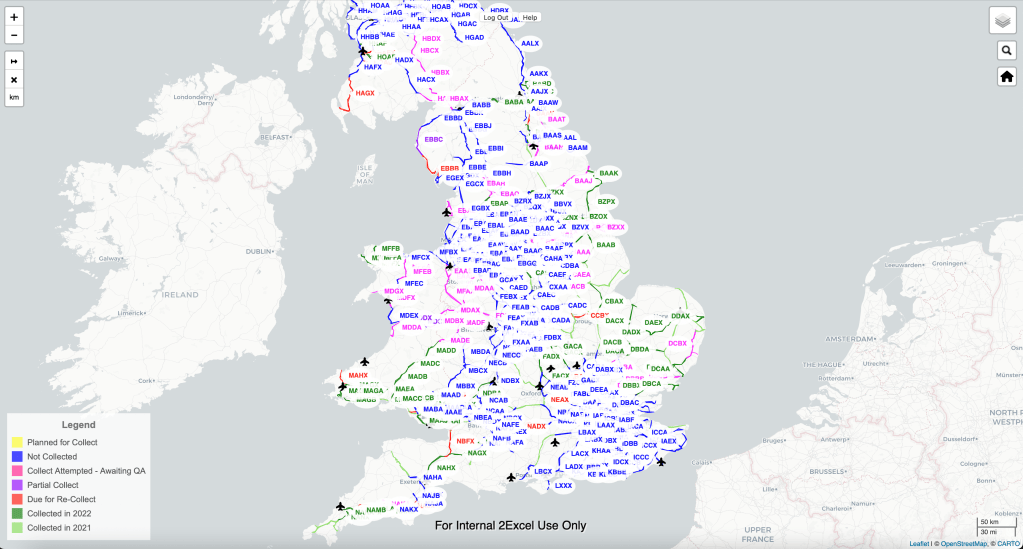
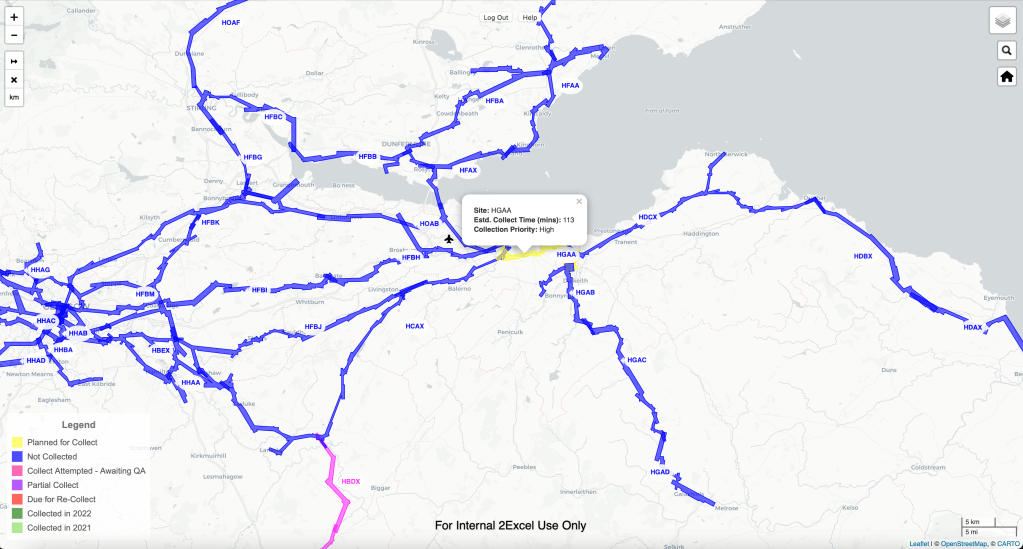
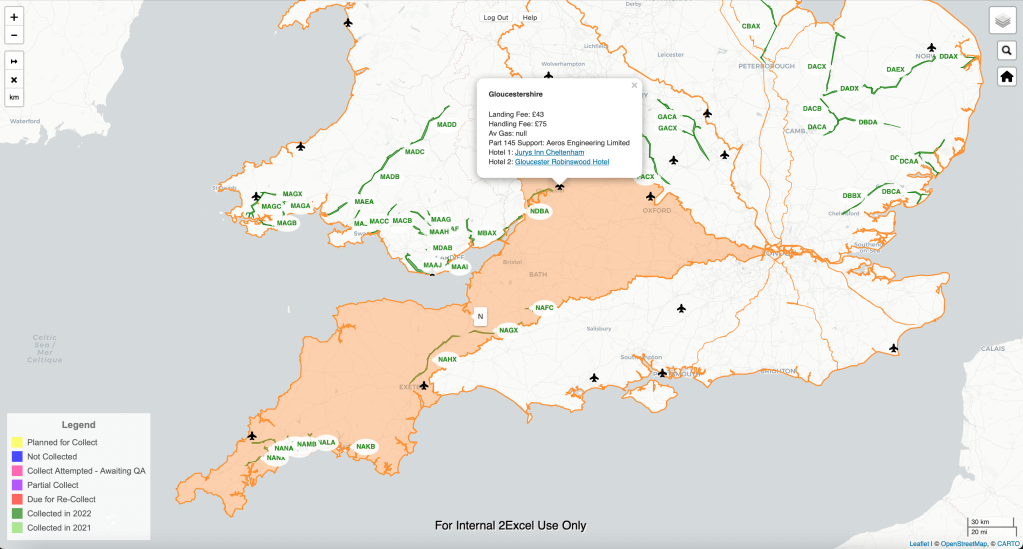
In addition to showing the status of all sites, which can be displayed in separate layers by collection status, hovering over any site highlights it in yellow and clicking on the polygon displays a popup with specific information for that site.
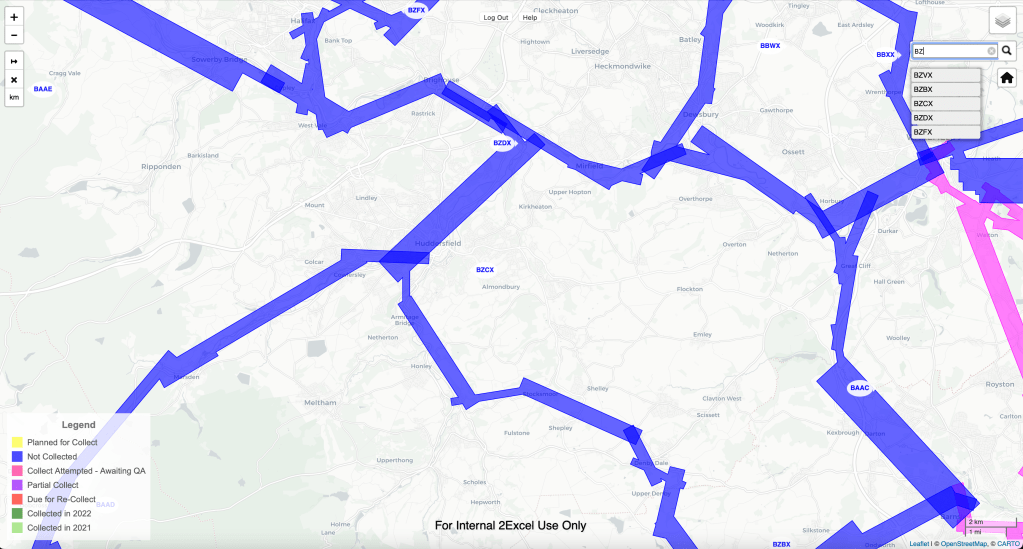
Additional functions include a search feature for easily finding a desired site, a home button to reset the view to that shown on initial page loading, and a measurement tool to measure geodesic distances between one or many locations. The map also shows various static information such as airports that flight crews can use, with information about each one, and the Network Rail divisions of the country into Regions and Routes.
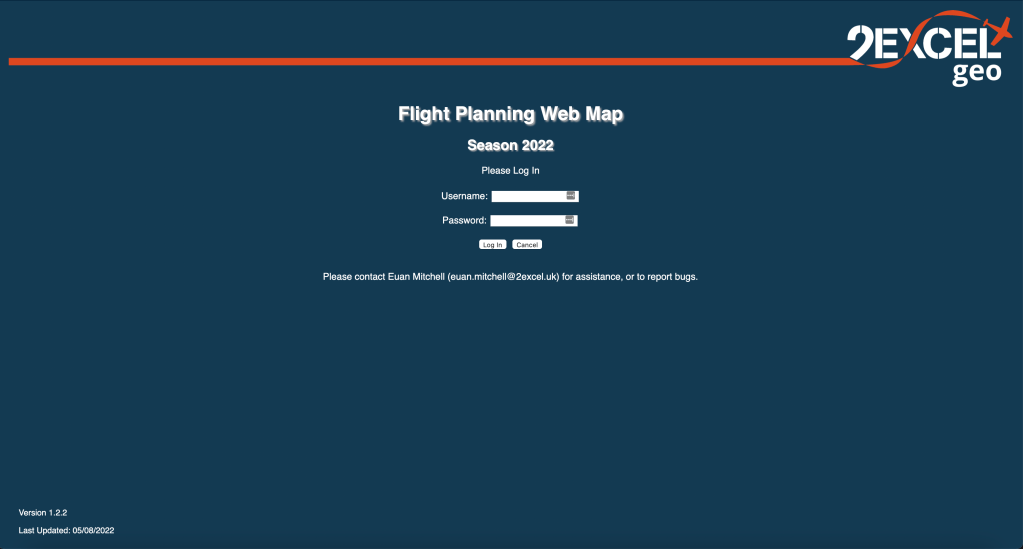
The web map is secured and login/logout functionality is controlled by a small amount of PHP code. This took advantage of skills that I gained during the Web Applications for Everybody specialisation on Coursera.