This was my final project for Course 4 of the Coursera specialization, the last one before the capstone. Unlike previous courses, where the assignments were predefined, here we had the flexibility to choose our own topic. The only requirements were that our workflow involved a supervised classification of at least one satellite image, and that at least a component of our analysis was performed using ModelBuilder, an ArcMap tool for automating GIS workflows.
Introduction
I decided to analyze the ‘Puna’ eruption of Kilauea volcano on the ‘Big Island’ of Hawai’i. This eruption made headlines around the world in May 2018, when new vents and fissures opened up in the Leilani Estates subdivision on the volcano’s lower east rift zone.
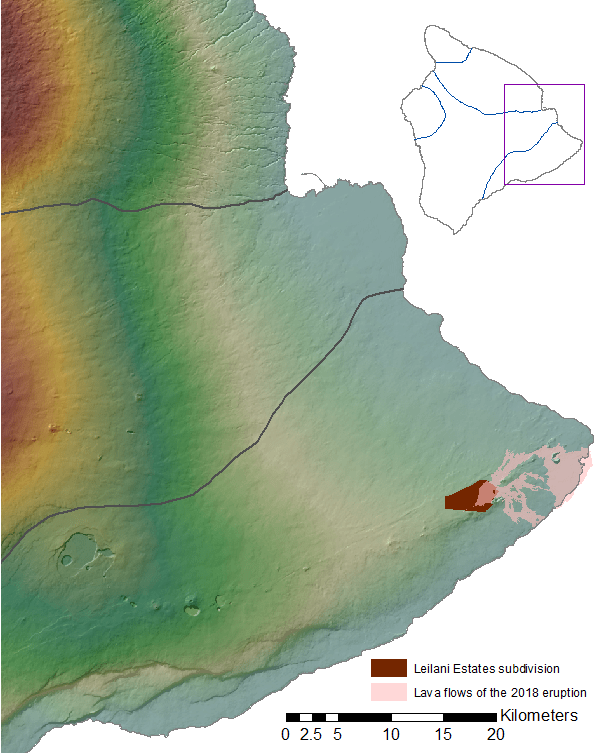
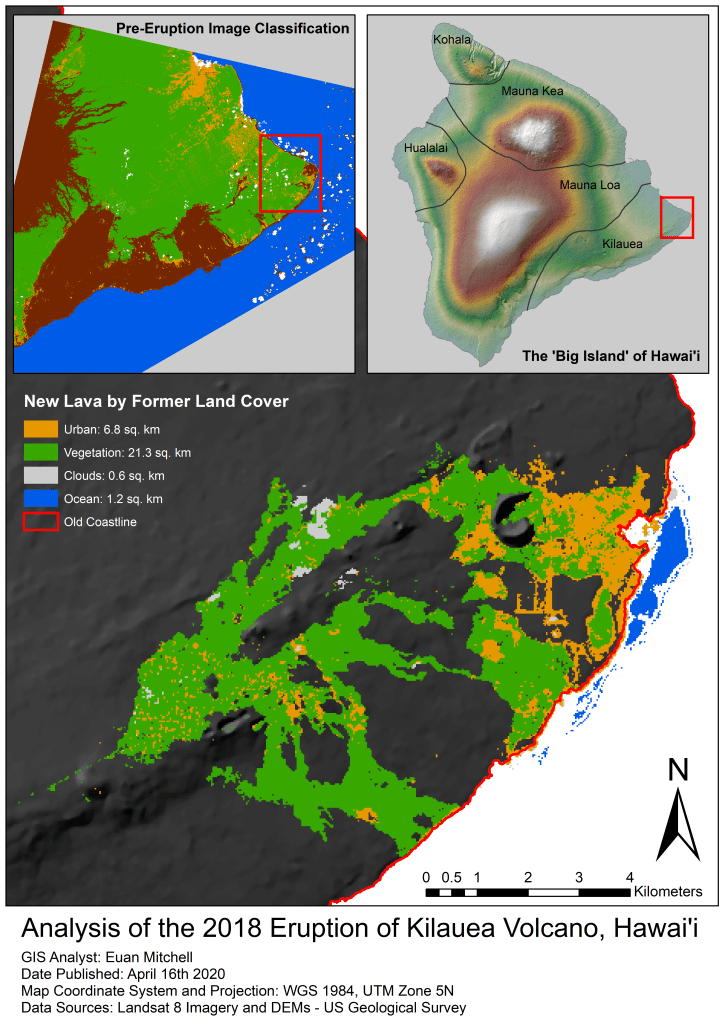
The shaded relief map to the right shows the eastern portion of the island, and most of the Kilauea volcano. The summit caldera, within Hawai’i Volcanoes National Park, is clearly visible in the bottom left corner. The east rift zone (ERZ) trends SE away from the caldera, before turning eastward toward the Puna region. The light pink shading along the lower ERZ shows the extent of new lava flows produced during the eruption between May and August 2018, as well as the footprint of the Leilani Estates subdivision.
Although the eruption impacted a small area of the ‘Big Island’, it occurred in a more populated area than the Pu’u O’o vent further up the ERZ, where the majority of activity has occurred since this eruption of Kilauea began in 1983. The number of houses destroyed is estimated to be more than 700 and the cost of recovery efforts is forecast to be greater than $800 million (Wikipedia).
In my project, I wanted to use satellite imagery to calculate the area of new lava flows produced, as well as the area of new land created when the flows reached the ocean and extended the shoreline. As a secondary aspect of the project I was interested in categorizing the prior land use of areas impacted by the new lava flows.
Satellite Imagery Analysis

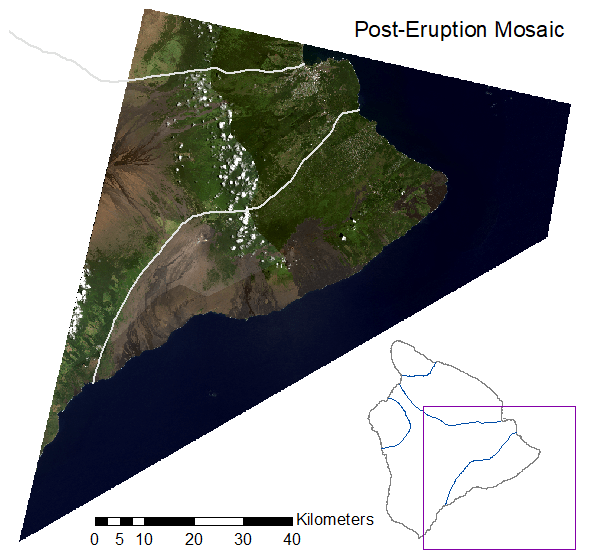
The first step was to find appropriate Landsat satellite imagery to use, which I obtained from the USGS EarthExplorer website. Given the small area affected, obtaining imagery that was as cloud-free as possible was important, although I was unable to find a single pre- and post-eruption image that was suitable. I resorted to downloading two pre- and two post-eruption images (from Jan. 3/Feb. 4 2017 and Feb 26/July 20 2019, respectively). For each pair I cropped one, and mosaiced it with the other image, before cropping out the majority of the image that was ocean, to produce the two images seen here.
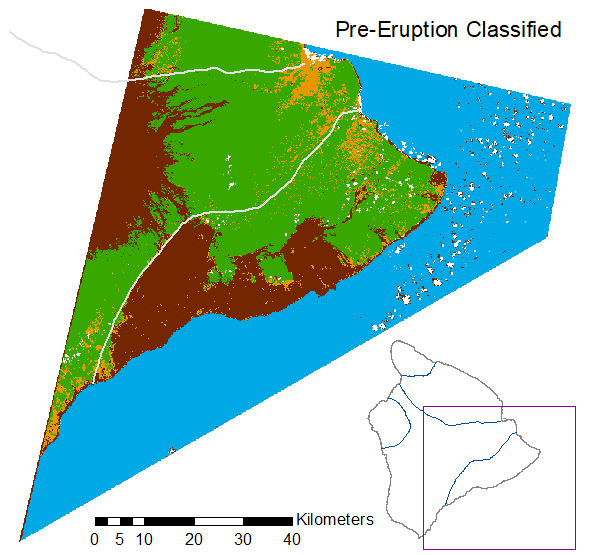
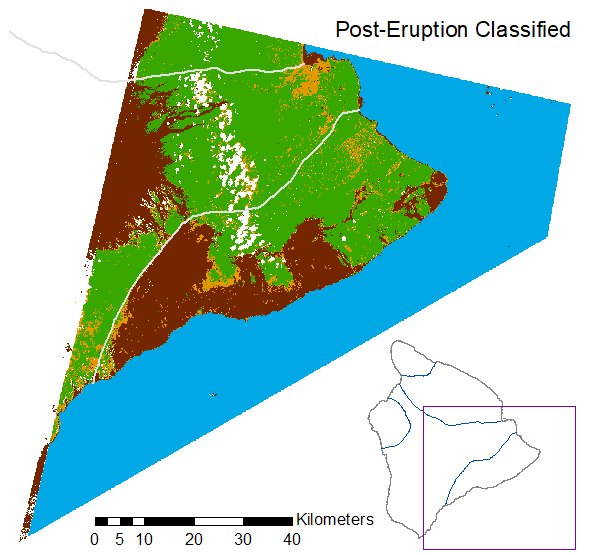
Next I ran a supervised maximum likelihood classification on each image with five classes: i) ocean; ii) clouds; iii) vegetation; iv) urban; and v) bare ground/lava. Essentially, this is a method of telling the software the class that certain parts of the image belong to (the ‘supervised’ or ‘training’ aspect) and then allowing the software to assign every pixel in the image to one of those pre-defined classes (the ‘maximum likelihood’ aspect).
Blue and white in these images represent ocean and clouds, respectively. Green is vegetated land, orange is urban, and dark brown is bare land or fresh lava. The process isn’t always perfect but the results were reasonable, as can be seen here. The new lava flows on the eastern tip of the island are clearly visible in the image at right. The software had some trouble differentiating partially vegetated land from urban areas, which are overrepresented, as well as issues with correct classification of some of the shallow coastal waters.
ModelBuilder Analysis
Now that I had a classified image from before and after the eruption, I could compare the two and identify the new lava flows (this is certainly not the most efficient way to do this, but I was working within the confines of the assignment guidelines). The following steps were automated in ArcMap using the ModelBuilder tool. The general workflow is outlined below and the ArcToolbox containing the model is available upon request.
To identify areas of new lava I:
- reclassified each image according to the following scale:
- Ocean = 1
- Cloud = 2
- Vegetation = 4
- Lava = 8
- Urban = 16
- subtracted the post-eruption re-classified raster from the pre-eruption re-classified raster – this resulted in a new raster with a unique value for each pre- to post-eruption land use change (i.e., in this new raster the values 7, 6, 4, and -8 represented lava in the post-eruption image that had been ocean, cloud, vegetation, and urban, respectively, in the pre-eruption image – areas that were lava in both images would have a value of zero)
- used the “Con” tool to create a new raster containing only cells with one of the four values above – i.e., a raster of new lava
- applied a mask to subset that raster to the area where the eruption occurred – this minimized ‘false’ identifications of new lava based on errors in either the pre- or post-eruption image classification
- finally I added a new field to the raster attribute table and calculated the area of new lava as a function of previous land use
The result of this analysis is shown in the image to the left, which was the final product supplied for assignment grading. My analysis indicated a total of 29.95 km2 of new lava, of which approximately 70% previously had been vegetated land, and 1.25 km2 of new land added to the island. In the next section I compare these values to official U.S. Geological Survey (USGS) estimates, and do some further analysis of the effects of the eruption.
Further Analysis and Eruption Impacts
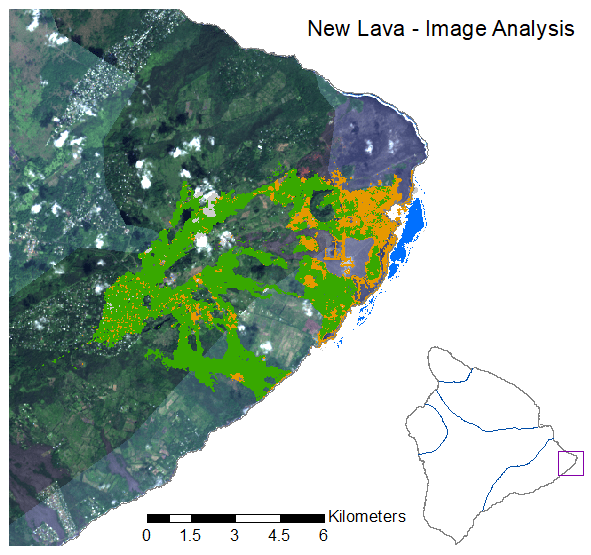
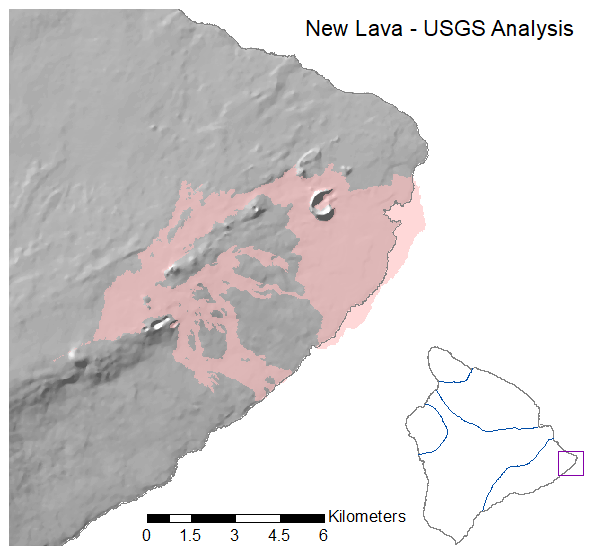
Having completed the satellite image analysis, I was curious to see how well my workflow had captured the changes that occurred during the eruption. Simply comparing the numbers, the USGS estimate about 35.5 km2 of land was covered by lava, including 3.5 km2 of new land (USGS Summary). The on-land estimate compares relatively well, especially when considering that the biggest source of discrepancy is in areas where new lava flows covered existing ones (top image at right). These areas are not captured by my analysis because they have a value of zero when the two classified rasters are subtracted. My estimate of new land created is significantly off however, although for a similar reason. For reasons that aren’t entirely clear, the supervised classification of the pre-eruption image identified a lot of shallow coastal waters as lava, thus when these areas were actually converted to land during the eruption they were not captured by the analysis. The two maps to the right show my areas of new lava (top, overlain on the pre-eruption satellite composite) and the USGS analysis (bottom).
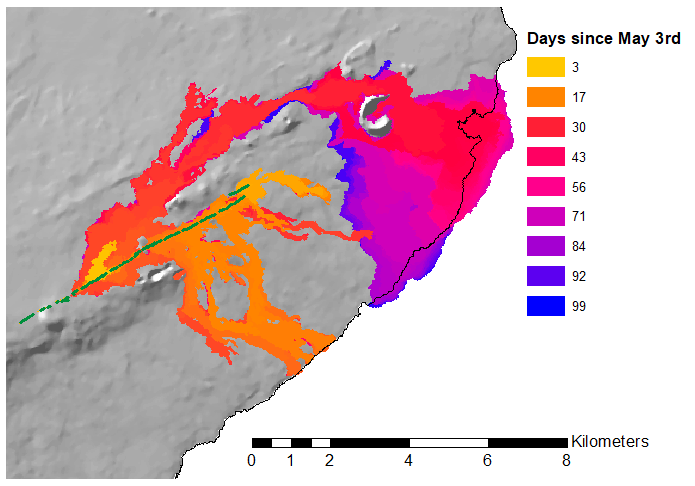
I used the shapefiles provided by the USGS, along with additional data from the State of Hawai’i, to do some final analysis of the impacts of the eruption. I began by making the image below, showing the progression of the eruption after the first lava flows appeared on May 3rd.
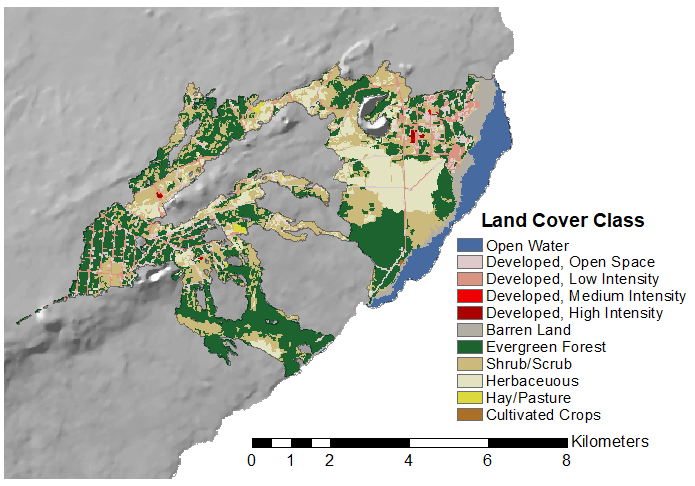
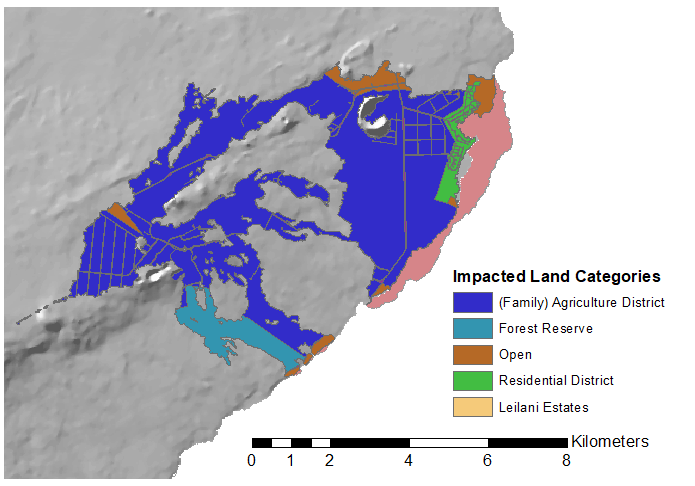

In the final stage of the analysis I wanted to estimate the different land areas that were affected. I did this with three separate datasets, one federal dataset from the USGS and two state level datasets from the Hawai’i Statewide GIS Program. The three derivative maps are shown to the left.
The first map uses data from the 2001 National Land Cover Database, which is a nationwide, 30 m cell size raster, classifying land cover into approximately 20 classes (NLCD). These data classify approximately 13 km2 of impacted land as evergreen forest, with another 9 km2 as shrub/scrub, and nearly 5 km2 as herbaceous vegetation. Only 0.01 km2 are classified as areas of cultivated crops in this data.
The second dataset from the Hawai’i Statewide GIS Program (Hawai’i Spatial Data Portal) is a zoning map of Hawai’i County from 2018. This dataset classifies the majority of the impacted area as agricultural or ‘family agricultural’ districts. A little over 2 km2 is classified as forest.
The third and final dataset, also from the state of Hawai’i in conjunction with UH Hilo, is an agricultural land use survey from 2015. This shows about 2 km2 of agricultural land in the impacted area, the majority of it used for growing papaya.
Conclusions
A supervised image analysis of Landsat 8 satellite scenes from before and after the 2018 eruption along the lower ERZ of Kilauea volcano was able to successfully identify about 85% of the onland area of newly erupted lava flows. In contrast, only about 36% of the area of newly created land was successfully identified. Further refinement of the training sample areas likely would be able to improve this.
The majority of the 30+ km2 of impacted land had been forested or agricultural land before the eruption. Papaya, and other tropical fruits, were the main agricultural products impacted by the eruption.
