The one where I begin to analyze the data ….
In the last post I detailed all the steps necessary to get my data into a form that I could feed into the suitability analysis, and the ModelBuilder model I constructed to do much of that work. As is always the case with GIS, and something this complex, the process was not as straightforward as just running that model. However, all of those steps are complete and I now have a nice collection of planet-wide rasters (and a very large data folder – 32 GB and counting!). I am now ready to build the second model that will reclassify all of these rasters.
Before I do that I want to create my mask though. In essence, this will be a single polygon that I will use to ‘cut out’ only those areas of the planet that meet certain requirements. The relevant engineering criteria are:
- Latitude less than 45 degrees
- Elevation less than 2000 m
- Albedo less than 0.25
- Thermal inertia greater than 100 J m-2 s-0.5 K-1
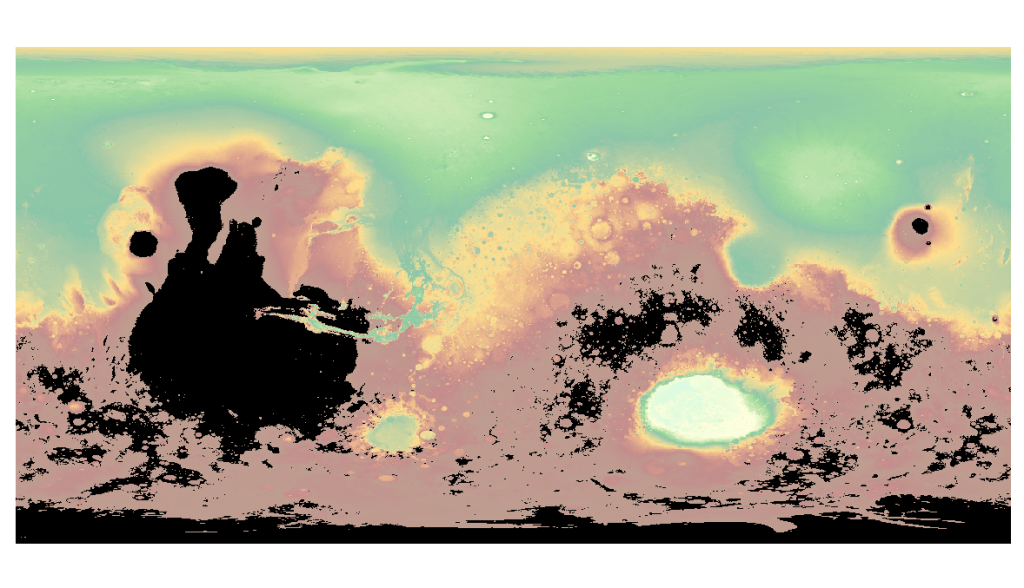
In addition, I will exclude areas that meet certain geologic requirements. For instance the young volcanic provinces and northern lowlands, which likely formed long after Mars became the cold, dry planet it is today. The image below shows the areas meeting all these criteria, which will be excluded from the final analysis. The underlying colour image, a digital elevation model, shows the areas from which landing sites can be selected.
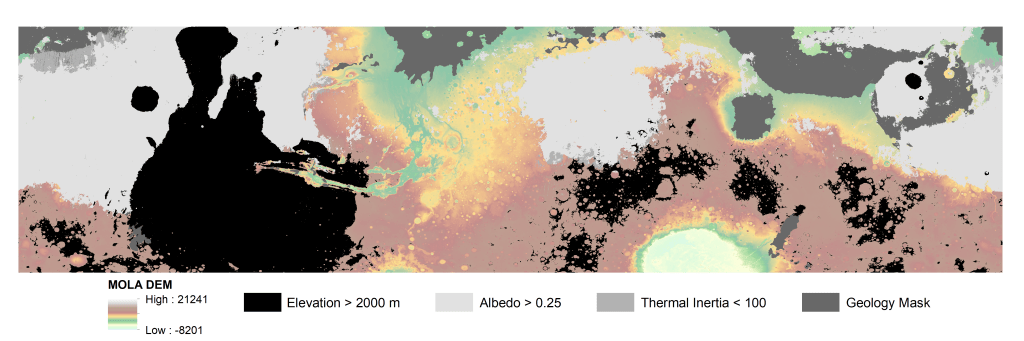
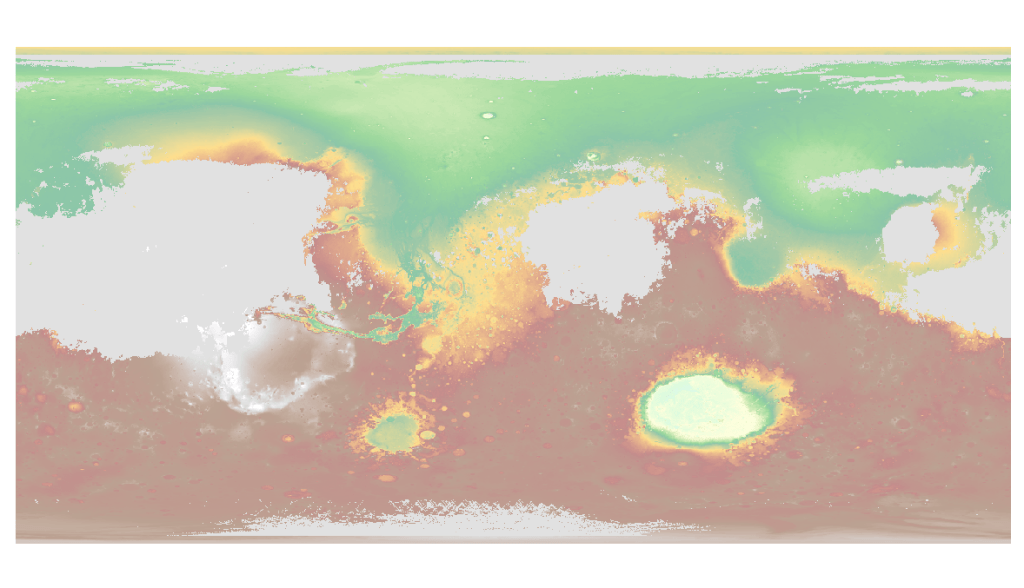
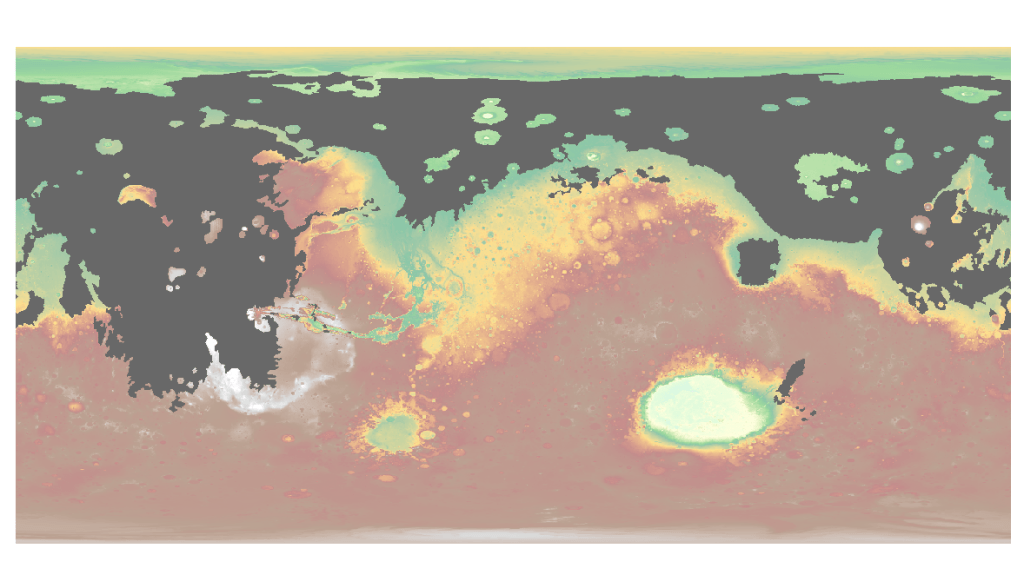
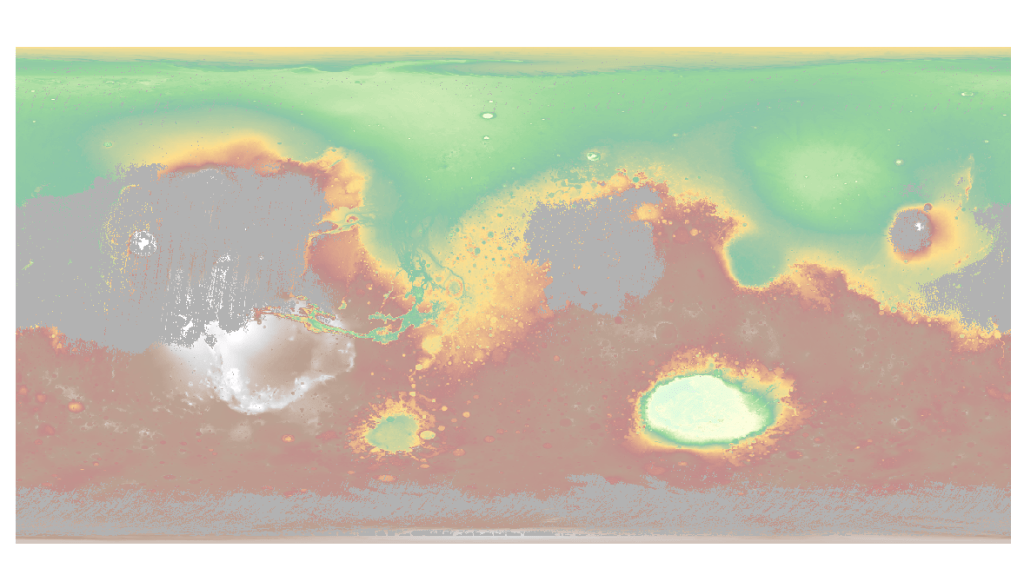
The elevation, albedo, and thermal inertia masks were made by selecting only the relevant cells from the corresponding rasters, and setting all other cells to ‘null’. Each of these rasters was then converted to a single multipart polygon, which is what is shown here shaded black or gray. The geology mask was created by selecting polygons from a global geologic map representing units that are not of interest. These were then dissolved into a single multipart polygon, shown here in dark gray. The four individual masks are shown below for the entire planet. The final analysis mask was made by ‘inverting’ this process. A single rectangular polygon was created for the 45 N to 45 S area (the extent of the coloured DEM above) and then the four mask polygons were cut out of this. The end result is a single polygon encompassing only the areas where the coloured DEM can be seen in the image above. That polygon will be used to extract valid cells from the final suitability raster.
Next up I have to reclassify all my rasters, feed them into the suitability analysis, and apply the mask I have created to generate my final suitability raster.